 |
If you intend to produce a hardcopy of this file, you will probably be happier printing the gzip-ed postscript version.
John Salmon - Christopher Stein - Thomas Sterling
We investigate two interconnection techniques that would allow the scaling of a Beowulf class system to unprecedented sizes (hundreds or thousands of processors). The first is a commercially available high-speed backplane with fast-ethernet and gigabit ethernet switch modules. The second is a network that combines point-to-point connections and commodity switches, employing the Beowulf nodes as IP routers as well as computational engines. The first method has the drawback of a relatively high price tag - a significant but not overwhelming fraction of the cost of the system must be devoted to the switch. The second approach is inexpensive, but introduces extra latency and may restrict bandwidth depending on the topology employed. Our tests are designed to quantify these effects.
We perform three sets of tests. Low-level tests measure the hardware performance of the individual components, i.e., bandwidths and latencies through various combinations of network interface cards, node-based routers and switches. System-level tests measure the bisection bandwidth and the ability of the system to communicate and compute simultaneously, under conditions designed to generate contention and heavy loads. Finally, application benchmarks measure the performance delivered to a subset of the NAS parallel benchmark suite.
Low-level measurements indicate that latencies are only weakly affected by introduction of node-based routers, and that bandwidths are completely unaffected. Switches introduce between 19 and 30 microseconds of latency and linux-based routers introduce 75 microseconds.
System level measurements indicate that even under load, the routed network delivers a bisection bandwidth near what one would expect by simply summing the capacities of the individual components. A very large scatter is introduced into latencies, however.
Application level measurements reveal that the routed network is acceptable for some applications, but can have significant deleterious effect on others. Successful use of routed networks for very large beowulf systems will requires a deeper understanding of this issue.
In the last few years, clusters of PCs including Beowulf-class systems have emerged as an important and rapidly expanding approach to parallel computing. Beowulf-class systems [3,4] are a natural consequence of several trends in computing: powerful and inexpensive mass-market microprocessors; powerful, robust and freely available operating systems; widespread adoption of message-passing APIs for engineering and scientific supercomputing applications; and high-speed, low-cost networking. Price-performance ratios for sustained execution has been achieved at $15 per Mflops for favorable (but non-trivial) scientific and engineering applications. LINPACK performance of over 20 Gflops has been reported, and over 10 Gflops has been sustained for scientific applications. Beowulf-class and other forms of clustered PC systems are becoming established as a new platform for accomplishing real-world moderate-scale (a few Gigaflops) computation in science, engineering, and commerce.
Beowulf-class systems are on the threshold of becoming supercomputers, but systems larger than a few dozen processors are still experimental. The future of Beowulf-class PC clusters for large-scale applications will will be determined by three issues: 1) architectural scalability, 2) development of latency tolerant applications, and 3) software environments and tools. This paper focuses on the first of these. Despite the success of many small (4 to 48 processor) Beowulfs, few systems of more than 100 processors have been installed and the design of such systems is largely unexplored. That such machines can be constructed and effectively applied using low cost COTS technology has yet to be established.
We consider the scalability of system designs capable of integrating hundreds or thousands of processors. We study the systems at the component level, the system level, and from the perspective of overall application performance. Both low-level synthetic benchmarks and real-world application benchmarks are employed to characterize the network components (hardware and software) and the overall system scaling characteristics. The purpose of this paper is to take an initial look at possible implementation strategies for large-scale Beowulf-class systems.
Beowulf designs are necessarily highly restricted. The individual components are constrained by the characteristics of available commodity networking systems. The particular choices and made here are driven by the characteristics of fast ethernet based technologies which has been widely adopted systems due to its excellent cost and adequate performance.
The ultimate network would offer high performance and reliability, be inexpensive, and would be scalable at linearly increasing cost up to thousands of processors without significant degradation in performance. Unfortunately, such a network is not likely to exist any time soon. Fast ethernet constitutes a significant compromise, with its greatest advantage being low cost and its greatest drawbacks being high latency, modest bandwidth and limited scalability.
It is not appropriate to include a detailed tutorial on fast ethernet technology here. However, a few details are crucial to an understanding of the networks we propose below. We refer to the computational elements in our system as nodes. Practically speaking, a node is a single motherboard/memory bus, which may have one or more processors. Nodes are also equipped with one or more Network Interface Controllers (NICs). Good quality NICs cost less than $50 and can send and receive data simultaneously at 100Mbit/s with end-to-end latencies in the neighborhood of 100-200 microseconds.
Nodes can be connected in three ways:
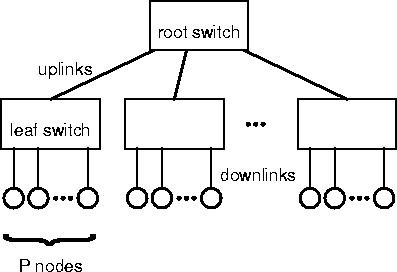
Switches are the de facto standard connection component for small Beowulf systems. Although switches can be connected to one another with little or no difficulty, one of the architectural restrictions of ethernet is that the resulting network may not contain any closed loops. This severely limits our ability to construct a network purely from interconnected switches. A possible configuration is shown in Figure 1. This is the least expensive configuration capable of scaling Beowulf systems up to multiples of the size of an individual switch. For the cost of L switches with P ports, and one root switch with L ports one can interconnect up to L*P nodes in this way, but the the per-processor bisection bandwidth through the top switch is u/P, where u is the uplink bandwidth.
|
One possible solution to this problem is to use a higher bandwidth technology for the links between switches. In fact, several switches available today offer a small number (typically one or two) of ``Gigabit uplinks'' in addition to the standard 100Mbps ports. Gigabit ethernet (1000baseT) is still a very new technology, but there is every reason to believe that ever-larger gigabit switches will become available as moderate-cost commodity components in coming years. This might seem to suggest that 100Mbit switches with gigabit uplinks offer a path to scalable Beowulf systems. Unfortunately, in the same time frame, processor performance is likely to increase as well, and we will likely begin to exploit gigabit NICs and switches at the nodes of future Beowulf systems. At that point, the gigabit uplinks offer no advantage, and they will quickly be saturated by even a small fraction of non-local communication.
The second way to overcome the limitation on closed loops is to do routing. If a ``router'' is interposed between two switches, they can be isolated from one another, and not run afoul of the ``spanning tree algorithm'' that effectively enforces the no-closed-loops rule. Dedicated, standalone routers can be expensive, but it is also possible to use a coventional computer, i.e., a node, as a router. That is, the nodes of the Beowulf themselves can act as routers in the network. One simply installs more than one NIC in each routing node and the OS can be directed to forward messages by tranferring data between NICs. Routing entails software overhead which is manifested as an additional latency associated with multi-hop messages. It may also impact the rate at which intermediate nodes carry out user-level computations.
The ability to route between NICs on the same node opens an enormous class of network topologies for consideration. We abstract some key features of these topologies as follows. First, we assume that the each switch has P ports. We note that NICs are much less expensive than switch ports (by a factor of three or more), so we restrict our attention to networks in which each node has only one NIC connected to a switch and C NICs connected directly to other NICs/processors using point-to-point links. The more general case would allow more than one NIC per processor to be connected to switch ports, perhaps on different switches, and offers even greater flexibility at some increase in cost.
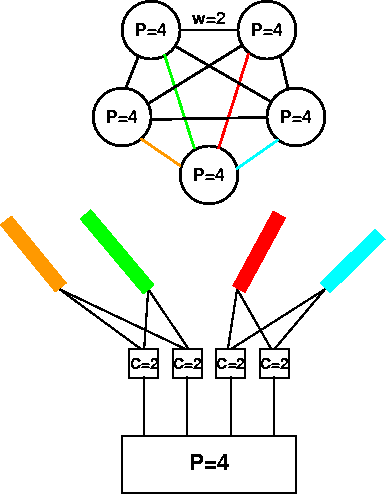 |
It is interesting to examine the diameter and bisection bandwidth implied by such a network. The diameter is the maximum number of edges between any two vertices. It is related to the maximum latency experienced by messages traversing the system. Such messages will be routed from vertex to vertex, incurring additional latency at each hop. Therefore, low diameter networks are probably preferable. Fortunately, the degree of the vertices is rather large, so there is little practical value in studying graphs with diameter greater than one. Communication networks are also characterized by their bisection bandwidth, i.e., the maximum bandwidth available between arbitrarily chosen halves of the system. The correspondence between the weight of each edge of the graph, and the number of individual network connections linking its vertices, allows us to compute the theoretical bisection bandwidth by summing the weights of edges.
The simplest graphs to consider are homogeneous and fully connected, i.e., every meta-node is connected to every other one by an equal number of point-to-point links. The weight of each edge is then P*C/(L-1), and there are (L/2)2such edges crossing any bisection (for even L). Therefore, the bisection bandwidth per node is (C/4)(L/(L-1)). The diameter, of course, is one. With C=3, the bisection bandwidth per node is over 75% of the bandwidth of a single point-to-point connection, suggesting that bandwidth-limited applications may be able to scale up from smaller Beowulf systems with only moderate degradation in performance.
In a fully connected network L cannot be larger than (P*C+1), so the overall size of the system is limited to N < P(P*C+1) - theoretically scalable up to thousands of processors with currently available commodity components. Of course, the are a host of other problems that bear on the viability of such large systems, but at least they are buildable in principle.
We report three classes of measurements designed to evaluate network choices from the perspective of elementary building block performance, aggregate network performance, and application performance.
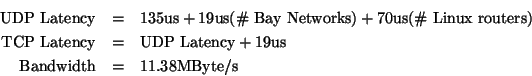
We have constructed a small set of elementary mini-networks and run a selection of the lmbench[2]. suite of networking tests on them. In particular, we have measured TCP and UDP latencies and socket bandwidths
Table 1 shows
results from lmbench.
These network configurations were chosen because
they constitute elementary components of the larger point-to-point
networks under
consideration.
We also measured the performance of one and two
Lucent (formerly Prominet) P-550 Cajun switches
with a
maximum internal switching capacity of 22.88Gbit/s, and six available
modular slots.
We used modules with 20 switched fast ethernet
ports and linked the two Cajun switches together via trunked
gigabit ethernet modules.
In each test, the network was unloaded except
for the processors involved in the test. Thus, these tests reveal
the best-case behavior when there is no contention for resources.
The data in the table are closely fit by the following rules:
|
|
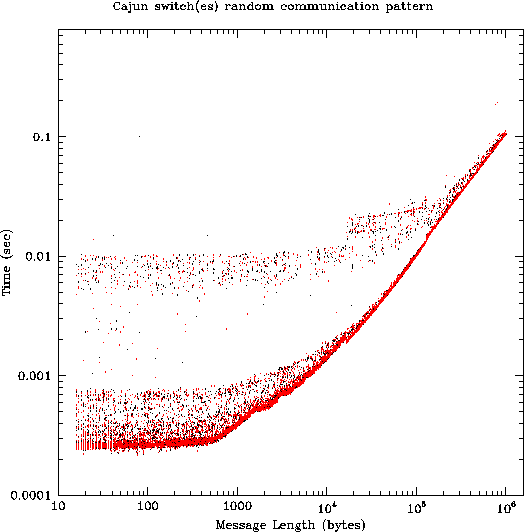
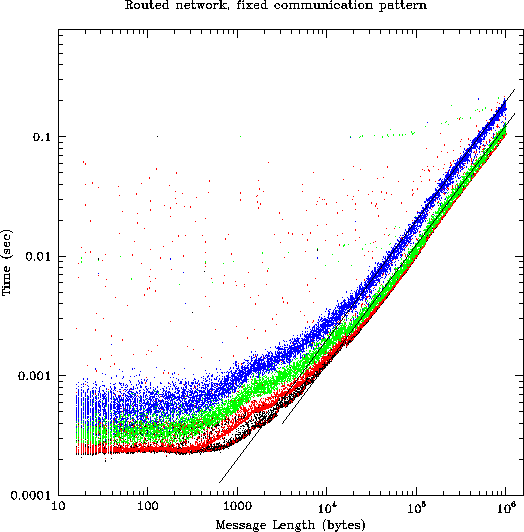
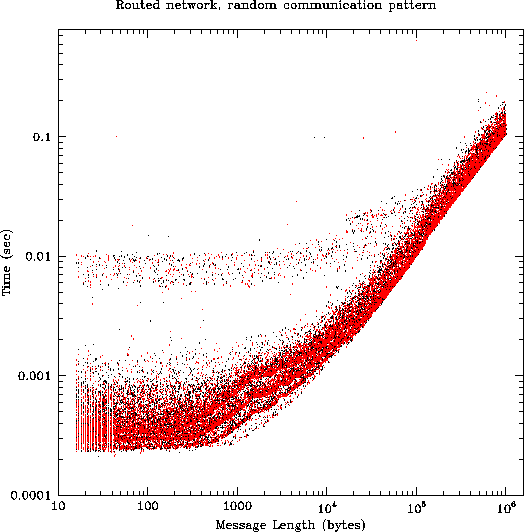
The figures in this section are all scatterplots of time vs. message length for 9000 ``ping-pong'' message transfers carried out between 36 processes in one of our test configurations. Each process sent and received approximately 250 messages of varying sizes. For message traffic, the time displayed on the vertical axis is actually half of the out/back time measured by the code, i.e., it is an estimate of the time required for a unidirectional message of the given length. All processes were running simultaneously, subject to our ability to ensure this by starting measurements immediately after a call to MPI_Barrier.
There are 18 point to point eth2 connections. Nodes are grouped together into switch groups 1 - 4 according to the bay switch they are connected to. Each group has 3 nodes connected by point to point eth2 to 3 nodes on every other switch group. On any given bay switch L and remote switch R there are six nodes on L not connected to a node on R by eth2. These use a connected node on L that is connected to R as a gateway to all other nodes on R. The gatewaying is distributed across the connected nodes by source, so that each of the three connected nodes gateways for two of the non-connected nodes. From source to destination, an IP packet will traverse at most 2 gateways. Of the 35 remote nodes in the system, 9 are reachable directly in one hop, 14 are reachable in two hops, and 12 are reachable in three hops.
A script configures the kernel IP routing table. The correctness of the routing was verified with a sequence of traceroute tests and analysis of the routing table.
We used two basic configurations to study two different classes of networks:
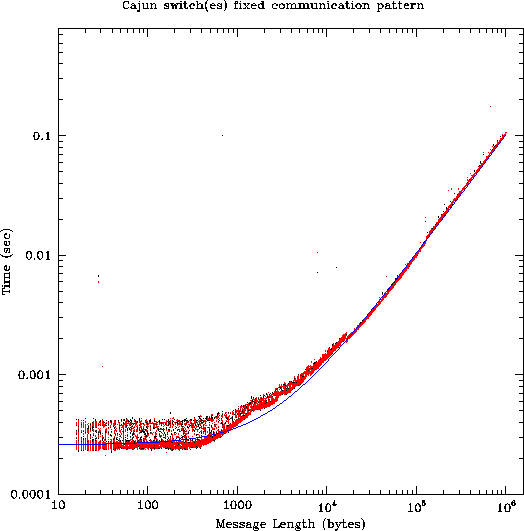 |
Figure 3 shows MPI performance with two different fixed patterns
of communication using the Cajun switches - one in which
all communication takes place within a single switch, and the other
in which all communication takes place over the gigabit fiber links connecting
two switches. It is reassuring that
the two configurations appear to be indistinguishable, confirming that
the trunk connection between the two switches is not a bottleneck.
In addition, this is our first indication that the conventional
formula relating communication time to message length may be inadequate:
 |
 |
 |
 |
We were unable to run several codes to completion, suggesting that there may be lingering bugs in our system. Nevertheless, those results that were successfully verified are shown in Table 2. Note that no effort was made to map the calculations onto the hardware topology. The very dramatic differences in latencies and bandwidths across different communication paths (c.f. Figure 5) suggests that this could make a significant difference in the overall outcome. The results in Table 2 are encouraging in the sense that the routed network does not greatly underperform the more expensive Cajun network. However, it is clear that there is a real performance degradation even on relatively small networks.
The scalable networks proposed here deliver component-level latencies and bandwidths comparable to those seen in much smaller switched networks, and scale easily to several hundred nodes.
Contention for resources, both network and computation, introduces additional effects beyond the component-level measurements. Our results indicate that the trunked Cajun switches hold up very well under load, while the routed networks are more problematical. Under load, a large variance is introduced into the time required for message delivery. While most messages are delivered within a time consistent with the component-level measurements, a non-trivial number suffer a delay of 10000us or more, and there are even rare instances of delays approaching 0.1us. The resulting network performance is not adequately characterized by a single latency and bandwidth. There are important topological effects (some virtual connections have three times the average latency of others), as well as a large spread in observed message times, even between topologically equivalent pairs.
The effects of this complex network behavior on a small suite of application benchmarks reveals that there is a significant cost to using routed networks. The overall effect is different for each of the programs in the NAS benchmark suite, and in fact, there are probably still opportunities for improving the results by altering the mapping from logical connectivity (expressed in the software) to physical connectivity (expressed in the wiring of point-to-point links). The initial results here are grounds for cautious optimism that routed networks can be used for larger systems, but further study is required to determine if the observed problems can be reduced or overcome.
The measurement code used to generate the data in Section 3.2 is available electronically at http://www.cacr.caltech.edu/~johns/papers/sc98/. If you are reading this electronically, it may also be available in the directory src/ relative to the location of this document. The program is written in ANSI C with calls to MPI libraries. It should be reasonably portable, but it has only been compiled and run on PentiumPro Linux systems with egcs, mpich-1.1.1 and glibc.
This document was generated using the LaTeX2HTML translator Version 98.1p1 release (March 2nd, 1998)
Copyright © 1993, 1994, 1995, 1996, 1997, Nikos Drakos, Computer Based Learning Unit, University of Leeds.
The command line arguments were:
latex2html -short_extn -split 0 v7.tex.
The translation was initiated by John Salmon on 1998-08-10